|
Modeling of the carbonate system balance changes connected with phytoplankton bloom Evgeniy V. Yakushev P.P.Shirshov Institute of Oceanology, 23 Krasikova St., Moscow 117218 Russia ABSTRACT
The goal of this work is to study the origin and interrelationships of the different processes affecting the carbonate system transformation during the bloom, and especially biogenic carbonates formation and also to obtain numerical estimates of the biogenic carbonates formation during phytoplankton intensive production. For this a mathematical model was used. The processes of carbon chemical-biological cycle, air-water exchange and carbonate system transformation were described. A special iteration scheme was used to describe the carbonate system balancing after the carbon dioxide consummation took place. On the base of modeling it was shown that the amount of potentially precipitated during the bloom period CaCO3 should be up to 20 mM l-1. The changes of carbon alkalinity can reach 0.030 mg-eq l-1. The differences of carbonate system parameters behavior including CaCO3 formation is significant enough to be measured during the field investigations of the standard carbonate system parameters with the modern technique accuracy.
Introduction The dramatic increase in atmospheric carbon dioxide (CO2) concentrations observed during the past decades can be associated with the natural climatic oscillations or/and with anthropogenic influence. Concern about the potential role of CO2 as a “greenhouse gas” had led to necessity of investigation of this element global biogeochemical cycle peculiarities. The oceans play an important role in this cycle, containing large reservoirs of dissolved inorganic carbon as gaseous CO2(g), bicarbonate (HCO3-) and carbonate (CO32-) ions. Because of it, the ocean ultimately determines the atmosphere's CO2 content (Siegenthaler, Sarmiento, 1993). Information about the CO2 system behavior can be obtained by investigations of the processes which affect the carbonate system parameters distribution and variability. One of the most interesting aspect of this problem is the role of marine biota. When we speak about this, we consider the aggregation of gaseous CO2 into particulate organic carbon (POC), which can be transported into the deeper layers, sedimented on the bottom and thereby excluded from the global cycle and also of the POC mineralization and respiration processes (so-called “soft tissue pump” (Gruber et al, 1996) . However during the phytoplankton bloom the decrease of CO2 is accompanied by disbalance of the system which can initialize the activity of the other “pumps”: (“solubility pump” - ocean-atmosphere CO2 exchange, and “carbonate pump” - and formation dissolution of calcium carbonates). Therefore it is impossible to study a separate process apart from others, and the optimal way is the using of a mathematical model, which allows to describe the influence of processes in there interactions. Generally, the concentrations of the oceanic carbon system parameters are ruled by several complex processes, the most important of them are presented in Table 1. Table 1. Processes influensing the oceanic carbonate system parameters
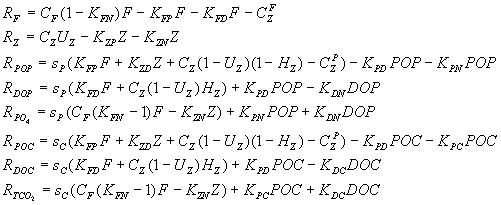
In an ideal situation all these processes would be parameterized in the model. But practically, depending on the timescale of investigated processes, it is possible to linearize and simplify part of these processes. For example, if we study fast processes of water-air exchange it is not necessary to take into consideration the sedimentation processes. From the other side, if we study geological scale sedimentation processes, the non-linear processes of chemical-biological transformation can be replaced by a constant. This can be proved using “pure mathematical” Tikhonov theorem on the reduction of differential equation with small parameters. Since the focus of this model is to study interaction of biological processes, carbonate system and air-water exchange, we decided to use a model which can describe changes from days to months. Another reason for investigating these very timescale processes is that the majority of serious complex field investigations, in which biological, chemical and hydrophysical parameters are measured together, can reflect the changes with the same scale from days to months. Therefore the goal of this work is to study with a mathematical model how the superposition of biological, chemical and hydrophysical processes reflect in the field observation data. During the bloom the consummation of gaseous CO2 by phytoplankton leads to the disbalance of the carbonate system equilibrium. This results in increased pH values and therefore in changes in the carbonate system balance toward increases in carbonates and additional decreases in gaseous CO2. In other words, during the bloom the upper layer gaseous carbon dioxide decreases for two reasons - consummation of the organic matter synthesis and transformation from gaseous CO2 to CO3, initiated by pH changes. In this case during the bloom period one can observe decrease of TCO2 and dissolved CO2 while the value of carbonate alkalinity (AlkC) remains constant to fulfill the sea water electricity neutrality equation (Millero, 1995, Dickson, 1992). But if during the bloom algae not only produce organic matter but also the calcite precipitation takes place one will observe also the AlkC changes. The calcite-precipitating organisms - coccolithophores - are widespread in the ocean. The remains of their skeletons covers 30-60 % of the ocean floor. By some accounts coccolithophores are the major biomass producers in the World today. They can form very intensive blooms reaching concentrations up to 108. specimens in one liter of water (Balch et al, 1991). Therefore, if the input of cocoolithophores into the bloom is significant one will face with changing of not only TCO2 and CO2 , but also with AlkC. The value of this influences remains unclear: there are observation data which supports that AlkC changes during the bloom and not (Makkaveev, Yakushev, 1983, Winter, Siesser, 1994). Methods According to the made above estimates of the time-scales comparison we described in the mathematical model the carbon transformation according to the carbonate system equations, carbon chemical-biological cycle and air-water exchange processes. Since phytoplankton growth is generally not carbon-limited in natural conditions, it was necessary to describe the cycles of limiting photosynthesis nutrients. According to results of nitrogen (N) and phosphorus (P) cycle comparison (Yakushev, Mikhailovsky, 1994) it was found that both these elements cycles are able to describe the main features of limitation effect in this time scale. We chose P-cycle for its relative simplicity. The model scheme of matter transformation is presented in Figure 1. The following equation was used as a basic one: where Ci = F,Z,PO4,POP,DOP, TCO2,POC,DOC;
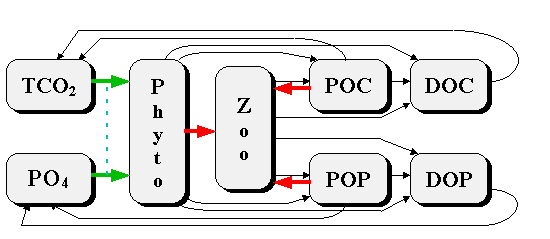
Figure 1. Model scheme of the matter transformation, where: phyto - phytoplankton, zoo - zooplankton, PO4 -phosphates, POP - particulate organic phosphorus, DOP - dissolved organic phosphorus, TCO2 - dissolved inorganic carbon, POC - particulate organic carbon, DOC - dissolved organic carbon. Thick arrows correspond to Michaelis-Menten formulation.
The following equations for the chemical-biological processes describe the processes shown in the Scheme (Figure 1) by arrows:
where: The non-linear Michaelis-Menten type functions were used to describe the consummation of the phosphates forms by phytoplankton and phytoplankton by zooplankton. The first order formula with a constant was utilized for the remaining processes, connected with metabolism and regeneration of particulate (POM) and dissolved (DOM) organic matter. f (PO4) = PO4/(KPO4 + PO4) - dependence of the phytoplankton growth rate on phosphates concentrations.
The influence of temperature was considered for the processes of photosynthesis rate and organic matter oxidation rates (Yakushev, Mikhailovsky, 1994). In Table 2 the numerical values and the names of the coefficients are shown. Their values were selected either from published data or were chosen from numerical experiments. The more complete description of the model is presented in (Yakushev, Mikhailovskiy, 1994). Table 2. The values of the model coefficients
Carbon and phosphorus were consumed by phytoplankton assuming constant C/P ratio. Due to accepted differences in organic phosphorus and carbon oxidation rates (Table 2) the C/P ratio differed in the organisms and dead organic matter. The rates of exchange of PO4, and TCO2 between the euphotic zone and the intermediate waters (1) was described using the concentrations gradient with coefficient wa=0.007 day -1. The wa coefficient is rather conditional, since it reflects both the processes of advection and turbulence. The carbonate system parameters were calculated on the base of carbonate system equations (Millero,1995). To describe the process of carbonate system balancing after gaseous CO2 was consumed by phytoplankton, the following iteration scheme was used: If TCO2(0), CO2(0), HCO3(0), CO3(0), pH(0), Alk(0) - are balanced system values before consummation, and TCO2(1), CO2(1) - are new values after consummation took place there were calculated: 1) pH(i) = f(TCO2(1), CO2(i)) 2) HCO3(i) = f(pH(i), TCO2(i)) 3) CO3(i) = f(Alk(0), HCO3(i)) 4) CO2(i+1) = f(TCO2(i), HCO3(i), CO3(i)) Where i - number of iteration. Based on constant values Alk(0) and TCO2(1), iterations were repeated till the differences between succeeded values became less than 0.001 mM l-1. To parameterize the biogenic calcium carbonate formation, it was accepted that the production of CaCO3 equals 20% of the primary production (Drange, 1996, Winter, personal communication, 1996). The exchange of CO2 across the air-sea interface is computed based on the Waninkhoff type formulation (Lyahin,1975, Wanninkhof, 1992):
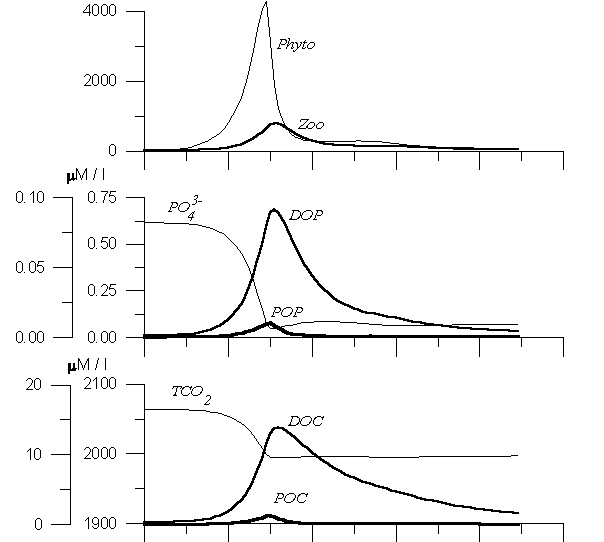
The model was devoted to describe the processes in high latitudes of the ocean, where the intensity of bloom is significant enough to demonstrate its influence on the system. The previous version of this model was calibrated on the White Sea expedition data obtained in 1991 (Yakushev, Mikhailovsky, 1994, 1995). To reach the main goal of the model (to study of influence of bloom in case of presence of calcite formation and without it) it was considered the development of the system in a relatively short period of about 3 months starting from time of a week before the spring phytoplankton bloom was studied. The environmental features were described in rather conditional way. Such a short duration of simulation period to simplify the hydrophysical processes influence parameterization. It was accepted that the temperature and salinity values were constant during the investigated period as well as exchange of PO4 and TCO2 with intermediate waters. The variability of light in spring was parameterized as a the simple sinusoid curve fragment. To obtain the balanced initial conditions for the numerical experiments, the calculations were repeated for several years till difference disappeared. Results The obtained results are presented in Figures 2 and 3. In Figure 2 the results of numerical experiment without the carbonate’s precipitation are shown (“non-coccolithophore bloom”), while in Figure 3 the behavior of carbonate system parameters in case of carbonate’s precipitation is presented (“coccolithophore bloom”). The model phytoplankton bloom (Figure 2) was characterized by primary production from 50 to 400 mgC m-3 and had duration about a month. The maximum phytoplankton biomass was about 3000 mg m-3. The phytoplankton bloom was followed by the zooplankton intensive growth period. Such a picture of plankton development can be observed in the northern latitudes (Vinogradov, Shushkina, 1988). Following the scheme (Figure 1), this resulted in a decrease of PO4 and TCO2 concentrations and an increase of organic forms of these elements concentrations (Figure 2.).
Figure 2. Variability of the model components during the phytoplanktom bloom. Numerical experiment without CaCO3 precipitation by algaes.
During the summer months a quasi-equilibrium took place, when sufficient light conditions and constant low PO4 flux from the intermediate layer resulted in the quasi-constant phytoplankton and zooplankton concentration. At the bloom beginning one can observe the decrease of dissolved inorganic carbon in the form of neutrally charged CO2 at 10 mM l-1 and corresponding increase of pH values on 0.20. This anomaly in pH values during the phytoplankton bloom period caused in temporary increase of CO3 content on 60 mM l-1. The decrease of bicarbonates (on 210 mM l-1) was more sharp, than decrease of TCO2 curve (on 70 mM l-1), because the additional processes of transformation of HCO3 into CO3 took place. The latter process was intensive according to this model experiment assumption: the abscence of the carbonate alkalinity AlkC (Figure 2).
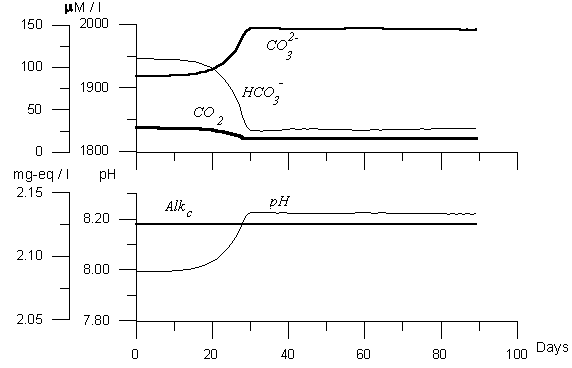
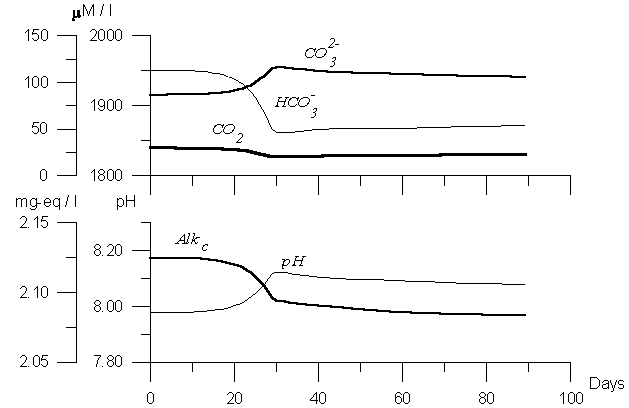
Figure 3. Variability of the model carbon dioxide components. Numerical experiment with assuming CaCO3 precipitation by algaes.
Differ from picture in Figure 2, in Figure 3 the results of “coccolithophores bloom” is presented. In this case we have the decrease of CO2 with the same value as in Figure 2, but the behavior of other parameters differed. The decrease of HCO3 was more gentle (90 mM l-1) while the increase of was not so sharp, and difference of CO3 concentration before and after the bloom was less than 40 mM l-1. The amount of precipitated during the bloom period CaCO3 was 20 mM l-1. Because of this process the changes of pH were smaller (0.15). And, finally, the changes of carbon alkalinity were about 0.030 mg-eq l-1. Therefore, in case of intensive bloom of coccolithophore or mixed plankton, one should observe the alkalinity changes significant enough to be measured with the modern technique. The value of alkalinity should change depends on primary production value and the percentage of input of coccolithophore in the bloom formed by mixed plankton. In case of optimal conditions: the bloom initiated only by coccolithophores with high intensity the changes of alkalinity should not exceed 0.030 mg-eq l-1. Conclusion Modeling is the instrument of joint analysis of processes that by our opinion influence observed parameter’ distribution and variability. It answers the question: ”What will happen, if:”(in our case - if we consider that during the phytoplankton bloom the light increased as sinusoid curve, while the flux of nutrient to euphotic zone was constant, etc.). Therefore, the model helps one to understand the reasons of the observed changes and, in the best variant to estimate numerical links between processes and the results of their activity. The obtained results are: The estimated values of the changes in carbonate system parameters during phytoplankton bloom that so called biological “soft tissue” pump accompanies and follows to intensification of the “solubility” and the “carbonate pump”, influence of them on carbonate system is more intensive than of “pure grazing”. On the base of numerical experiments it was shown that influence of phytoplankton bloom on the carbonate system resulted first of all in changes in pH values, that followed to displacement of the carbonate system balance: the decreasing of gaseous carbon dioxide content and temporary increase of carbonate ion value. Because of this, a temporary anomaly in the ocean-atmosphere exchange flux rate can take place (Yakushev, Mikhailovsky, 1995), and carbonate ion increasing. The changes of carbon alkalinity can reach 0.030 mg-eq l-1.The amount of potentially precipitated during the bloom period CaCO3 should be up to 20 mM l-1. Therefore, the differences of carbonate system parameters behavior including CaCO3 formation is significant enough to be measured during the field investigations of the carbonate system parameters with the modern technique accuracy. This aspect of fields investigation appears to be very important, because according to A.Winter (1996) estimates coccollithophores sequester about 1015 gC per year for all the globe. ACKNOWLEDGMENT: I am grateful to Frank Millero, Jorge Sarmiento, Nicolas Gruber, Amos Winter and Pavel Tischenko for discussing the ideas presented in this paper.
REFERENCES Balch, W.M., Holligan, P.M., Ackleson, S.G., and Voss, K.J., 1991. Biological and optical properties of mesoscale cocclithophore blooms in the Gulf of Maine. Limnol. Oceanogr. 36: 629-643. Dickson, A.G., 1992. The development of the alcalinity concept in marine chemistry. Marine Chemistry, 40(1-2): 49-64. Drange, H., 1996. A coupled isopycnic coordinate physical-biogeochemical model for the seasonal cycling of carbon and nityrogen in the ocean. In: CO2 in the Oceans. Int. Symp. hosted by the Univ. of Puerto-Rico, Mayaguez, 1996 Jan 22-26, Abstracts, pp. 57-58. Emerson, S., 1995. Enchanced transport of carbon dioxide during gas exchange. In: B.Jaehne and E. C. Monahan (Editors), Air-Water Gas Transfer, selected papers from the Third International Symposium on Air-Water Gas Transfer, 1995, July 24-27, Heidelberg University. AEON Verlag & Studio, Hanau 1995, pp.23 - 36 Gruber, N., Sarmiento, J.L. and Stocker, T.F., 1996. An improved method for detecting anthropogenic CO2 in the ocean. Global Biogeochemical Cycles, 1996 (in Press). Lyahin, Yu.I., 1975. Estimation of CO2 exchange rate between sea water and atmospheric air. Okeanologiya, 15(3): pp. 458-464 (In Russian). Makkaveyev, P.N., and Yakushev, E.V., 1983. Modeling of the vertical distribution of the total inorganic carbon in the photic layer of the oligotrophic regions of the ocean. Okeanology, 23(5): pp. 801-806 (in Russian). Millero, F.J., 1995. Thermodynamics of the carbon dioxide system in the oceans. Geochem. et Cosmoch. Acta, 59(4): pp. 661-677. Monin, A.S., Kamenkovich, V.M., and Kort, V.G., 1974, Variability of the World Ocean. Leningrad, Gidrometeoizdat, 262 p. Siegenthaler, U., Sarmiento, J.L., 1993. Atmospheric Carbon Dioxide and the Ocean. Monthly Nature, , 1(9): pp. 48-54. Vinogradov, M.E. and Shushkina, E.A., 1988. Functioning of Ocean Epipelagic Communities. Moscow, Nauka, 240 p.(in Russian). Wanninkhof, R., 1992. Relationship between gas exchange and wind speed over the ocean. J.Geophys.Res., 97: pp. 7373-7381. Winter, A., 1996. The role of coccolithphores in the Global Carbon Cycle. In: CO2 in the Oceans. Int. Symp. hosted by the Univ. of Puerto-Rico, Mayaguez, 1996 Jan 22-26, Abstracts, p. 83. Winter, A. and Siesser, W.G., 1994. Atlas of Coccolithophore. In: A. Winter and W.G. Siesser (editors) Coccolithophore. Cambridge University Press, 290pp. Yakushev, E.V. and Mikhailovsky, G.E., 1994. Simulation of Chemical-Biological Cycles in the White Sea. Calculation of Nitrogen, Phosphorus and Oxygen Annual Variability. Okeanology, English Translation, June 1994, 33(5): 611-617 (Russian Edition: September--Ocober 1993). Yakushev, E.V. and Mikhailovsky, G.E., 1995. Mathematical modelling of the influence of marine biota on the carbon dioxide ocean-atmosphere exchange in high latitudes In: B.Jaehne and E. C. Monahan (Editors), Air-Water Gas Transfer, selected papers from the Third University. AEON Verlag & Studio, Hanau 1995, pp. 37 – 48. International Symposium on Air-Water Gas Transfer, 1995, July 24-27, Heidelberg |